Danbooru
Login Posts Comments Notes Artists Tags Pools Wiki Forum More »
Search Changes Help | Posts (501) History
  • Help
guro
scat
furry -rating:g

Recent Changes (all)

  • arboliva
  • dolliv
  • smoliv
  • dachsbun
  • areadbhar (fire emblem)
  • gasamon
  • pawmot
  • pawmo
  • pawmi
  • quaquaval
  • quaxwell
  • quaxly
  • skeledirge
  • teletoon
  • crocalor
  • fuecoco
  • cream (vtuber)
  • meowscarada
  • keri.lu
  • sprigatito
  • alice thymefield (sea of thyme)
  • ukinami yuzuha (tanuki in broad daylight)
  • cu chulainn (honkai: star rail) (fate)
  • archer (honkai: star rail) (fate)
  • saber (honkai: star rail) (fate)

Options

  • Tag History
  • Post History
  • Wiki History
  • Discussions
  • What Links Here
  • Mistagged Posts
  • Untagged Posts

graph

図表

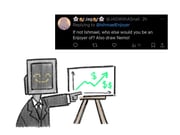
A graph is a visualization of numerical data. Examples include line graphs, scatter plots, bar charts, radar charts, pie charts etc.

When a graph makes use of two or three axis at right angles to one another (often with a grid), it is a Cartesian chart. Line graphs and scatter plots are examples of these.

Not to be confused with chart, which is generally for comparison charts between characters.

Examples

Bar chart
Pie chart

See also

  • chart
  • diagram
  • bar chart
  • pie chart
  • radar chart
  • stock chart
  • cartesian chart
  • stats
  • gauge
  • urine meter
  • presentation
  • Tag group:Image composition

The following tags are aliased to this tag: graph_(object) (learn more).

The following tags implicate this tag: bar_chart, pie_chart, and radar_chart (learn more).

Posts

post #9597693
post #9586478
post #9580984
post #9578037
post #9573307
post #9559624
post #9554872
post #9481382
Terms / Privacy / Upgrade / Contact /